Streamlit 和 很多库是兼容的:

安装
$pip install streamlit
安装的包:
Installing collected packages: terminado, prometheus-client, argon2-cffi, Send2Trash, notebook, widgetsnbextension, ipywidgets, pydeck, astor, cachetools, protobuf, jmespath, botocore, base58, validators, toolz, altair, pyarrow, s3transfer, boto3, tzlocal, blinker, smmap, gitdb, gitpython, enum-compat, streamlit
Successfully installed Send2Trash-1.5.0 altair-4.1.0 argon2-cffi-20.1.0 astor-0.8.1 base58-2.0.1 blinker-1.4 boto3-1.16.21 botocore-1.19.21 cachetools-4.1.1 enum-compat-0.0.3 gitdb-4.0.5 gitpython-3.1.11 ipywidgets-7.5.1 jmespath-0.10.0 notebook-6.1.5 prometheus-client-0.9.0 protobuf-3.14.0 pyarrow-2.0.0 pydeck-0.5.0 s3transfer-0.3.3 smmap-3.0.4 streamlit-0.71.0 terminado-0.9.1 toolz-0.11.1 tzlocal-2.1 validators-0.18.1 widgetsnbextension-3.5.1
演示
$ streamlit hello

  :waving_hand: Welcome to Streamlit!

  If you're one of our development partners or you're interested in getting
  personal technical support or Streamlit updates, please enter your email
  address below. Otherwise, you may leave the field blank.

  Email: your_email

  Privacy Policy:
  As an open source project, we collect usage statistics. We cannot see and do
  not store information contained in Streamlit apps. You can find out more by
  reading our privacy policy at: https://streamlit.io/privacy-policy

  If you'd like to opt out of usage statistics, add the following to
  ~/.streamlit/config.toml, creating that file if necessary:

    [browser]
    gatherUsageStats = false


  Welcome to Streamlit. Check out our demo in your browser.

  Local URL: http://localhost:8501
  Network URL: http://192.168.31.193:8501

  Ready to create your own Python apps super quickly?
  Head over to https://docs.streamlit.io
配置
根据提示 gedit ~/.streamlit/config.toml , 插入如下内容:
# 禁止收集用户统计信息
[browser]
gatherUsageStats = false

# 热加载,端口
[server]
runOnSave = true
port=8501

[runner]
# 禁止掉 magic commands
magicEnabled = false
示例页: http://localhost:8501, 感觉几个示例很cool :yum:
开发第一个app
参考这里
# first_app.py
#!/usr/bin/env python3
# -*- coding: utf-8 -*-
import streamlit as st
import numpy as np
import pandas as pd
st.title('第一个app')
直接执行如下命令就可以自动打开浏览器了:
streamlit run first_app.py
集成多个app
参考:Building Multi Page Web App Using Streamlit,该文章中称 app 为page容易让人误解。
记住Streamlit 本质上是一个顺序执行的 Python脚本程序, 在执行过程中当然可以像其他 Python程序一样调用任意其他 Python模块。
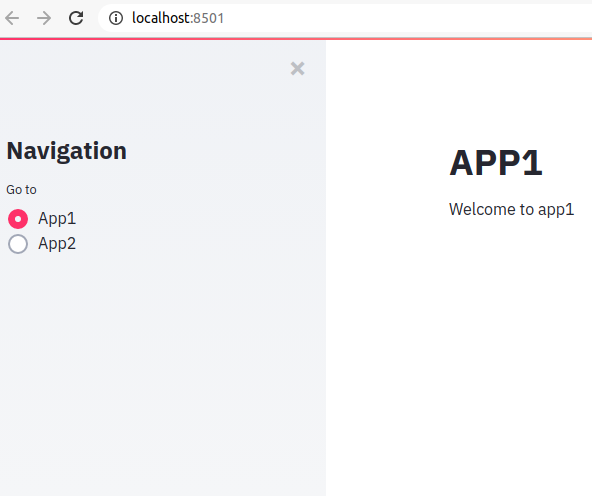
1. appMain.py:可以视为 streamlit 的入口脚本
#!/usr/bin/env python3
# -*- coding: utf-8 -*-
# refer to: https://medium.com/@u.praneel.nihar/building-multi-page-web-app-using-streamlit-7a40d55fa5b4
# appMain.py

import app1
import app2
import streamlit as st

# app列表,
appList = {
    "App1": app1,
    "App2": app2
}
st.sidebar.title('Navigation')
selection = st.sidebar.radio("Go to", list(appList.keys()))
appCurrent = appList[selection]
appCurrent.app()
2. app1.py 和 app2.py:被集成的脚本
app1,app2 可以视为 streamlit 顺序执行过程中被选择性调用的代码。
app1.py:
#!/usr/bin/env python3
# -*- coding: utf-8 -*-
# app1.py
import streamlit as st
def app():
    st.title('APP1')
    st.write('Welcome to app1')
app2.py:
#!/usr/bin/env python3
# -*- coding: utf-8 -*-
# app2.py
import streamlit as st
def app():
    st.title('APP2')
    st.write('Welcome to app2')
    selection = st.sidebar.radio("Go to", ['app2:Item1','app2:Item1'])
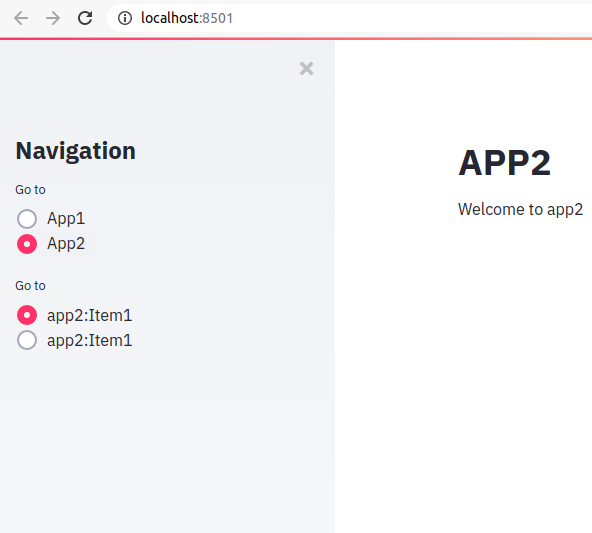
执行效果:


注意:app2 和 appMain 共用 sidebar
nginx 集成 streamlit
nginx端配置:
        server {
            location /streamlit {
                 proxy_pass       http://localhost:8501/;
                 proxy_http_version 1.1;
                 proxy_set_header Upgrade $http_upgrade;
                 proxy_set_header Connection "Upgrade";
                 proxy_set_header Host $host;
            }
需要同时部署对应的静态资源的部署, 静态资源目录在python包的类似如下位置: ~/lib/python3.8/site-packages/streamlit/static
Get started
示例1
涉及内容:
- mardown支持: 文本输出,空行输出
- 数值变量输出
- 折线图,地图
- magic commands:有时候会把一些注释显示出来,最好禁止掉
#!/usr/bin/env python3
# -*- coding: utf-8 -*-
import streamlit as st
import numpy as np
import pandas as pd

# markdown
st.write('# 1级标题')
st.write('## 2级标题')
st.write('### 3级标题')
st.write('~~删除线~~')
st.write('表格测试:')
st.write('''| Tables        | Are           | Cool  |
| ------------- |:-------------:| -----:|
| col 3 is      | right-aligned | $1600 |
| col 2 is      | centered      |   $12 |
| zebra stripes | are neat      |    $1 |

''')

# 插入空行
st.text('\n')

# st.write 可以接受很多数据直接输出

data_pd = pd.DataFrame({
    '第一列': [1, 2, 3, 4],
    '第二列': [10, 20, 30, 40]
})

# 输出表格:st.table 比较好用
st.write(data_pd)
st.text('\n')
st.dataframe(data_pd)
st.text('\n')
st.table(data_pd)
st.text('\n')

# magic commands:直接列出变量显示,等同于调用了 st.write() 方法
data_pd

# 折线图
chart_data = pd.DataFrame(
     np.random.randn(20, 3),
     columns=['a', 'b', 'c'])
st.text('\n')
st.table(chart_data)

st.line_chart(chart_data)

# 在地图上画点
map_data = pd.DataFrame(
    np.random.randn(10, 2) / [50, 50] + [37.76, -122.4],
    columns=['lat', 'lon'])

st.text('\n')
st.table(map_data)
st.text('\n')

st.map(map_data)
示例2:添加交互类小部件widgets
参考 https://docs.streamlit.io/en/stable/getting_started.html
涉及内容:
- 复选框,下拉选择框,左边栏,进度条
- 一行显示多个小部件
- 内容折叠显示
#!/usr/bin/env python3
# -*- coding: utf-8 -*-
import streamlit as st
import numpy as np
import pandas as pd
import time

# 使用复选框checkboxes显示隐藏数据
chart_data = pd.DataFrame(
       np.random.randn(20, 3),
       columns=['a', 'b', 'c'])

if st.checkbox('显示数据'):
    st.line_chart(chart_data)

# 下拉选择框,默认选中第一个
# 每次选中一个,整个脚本会重新跑一遍
df = pd.DataFrame({
  'first column': [1, 2, 3, 4],
  'second column': [10, 20, 30, 40]
})

option = st.selectbox(
    'Which number do you like best?',
     df['first column'],key='1')

'You selected: ', option

# 左边栏: sidebar
# 将小部件放入左边栏语法:st.sidebar.[element_name](/p/d41d8cd98f00b204e9800998ecf8427e)
# 需要使用key区分同一类别的不同小部件

option2 = st.sidebar.selectbox(
    'Which number do you like best?',
     df['first column'],key='2')

'You selected: ', option2

# 一行部署多个小部件
left_column, middle_column,right_column = st.beta_columns(3)
pressed = left_column.button('show right text')

if pressed:
    right_column.text("Woohoo!")
    middle_column.text("I'm here")

# 可扩展段落
expander = st.beta_expander("FAQ")
expander.text('''Here you could put in some really, really long explanations...
line2
line3
''')

# 显示进度, 用 time.sleep()模拟长时间的操作
st.sidebar.text('开始计算...')

# 显示占位符:文字和进度条
latest_iteration = st.sidebar.empty()
bar = st.sidebar.progress(0)

# 更新进度条内容
for i in range(100):
  # Update the progress bar with each iteration.
  latest_iteration.text(f'Iteration {i+1}')
  bar.progress(i + 1)
  time.sleep(0.1)

st.sidebar.text('...and now we\'re done!')
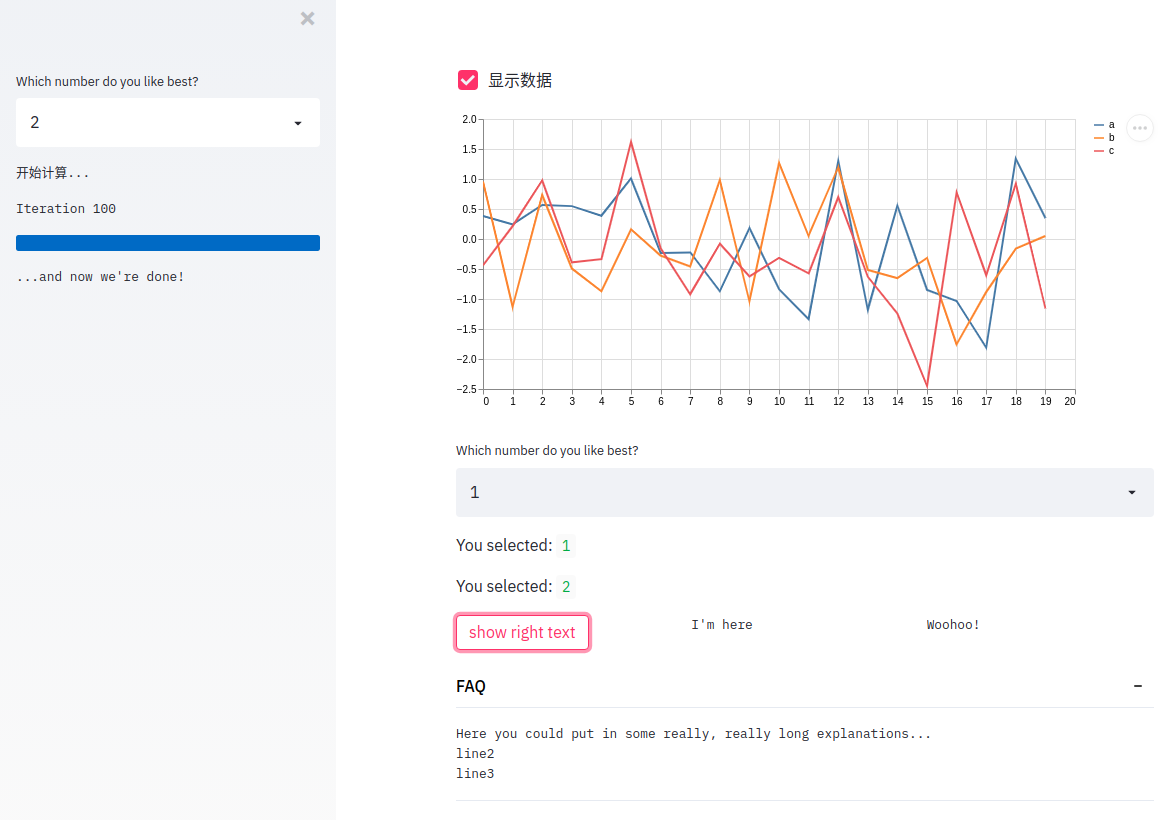
效果:

创建一个数据探索APP:Create a data explorer app
涵盖的内容:
- 数据加载,数据预处理,数据显示
- 使用
@st.cache标识函数 - 使用
st.slider滑动条过滤要显示的数据
附注释代码:
#!/usr/bin/env python3
# -*- coding: utf-8 -*-
import streamlit as st
import numpy as np
import pandas as pd

st.title('纽约市的优步接客数据分析')

DATE_COLUMN = 'date/time'
DATA_URL = ('https://s3-us-west-2.amazonaws.com/streamlit-demo-data/uber-raw-data-sep14.csv.gz')
'''数据部分内容:日期/时间,纬度/经度 latitude,longitude
Date/Time    Lat    Lon    Base
9/1/2014 0:01:00    40.2201    -74.0021    B02512
9/1/2014 0:01:00    40.75    -74.0027    B02512
9/1/2014 0:03:00    40.7559    -73.9864    B02512
9/1/2014 0:06:00    40.745    -73.9889    B02512
9/1/2014 0:11:00    40.8145    -73.9444    B02512
9/1/2014 0:12:00    40.6735    -73.9918    B02512
9/1/2014 0:15:00    40.7471    -73.6472    B02512
9/1/2014 0:16:00    40.6613    -74.2691    B02512
'''

'''
  使用 @st.cache 标识函数后,如果不是第一次调用该函数,
  并且如下三项内容没有变化, 不会再执行该函数而是
  直接返回上次的执行结果

- 函数本身没有变化:The actual bytecode that makes up the body of the function
- 函数依赖没有变化:Code, variables, and files that the function depends on
- 函数参数没有变化:The input parameters that you called the function with
'''

@st.cache
def load_data(nrows):
    # 读取指定行数的数据
    data = pd.read_csv(DATA_URL, nrows=nrows)
    '''
        Date/Time      Lat      Lon    Base
0     9/1/2014 0:01:00  40.2201 -74.0021  B02512
1     9/1/2014 0:01:00  40.7500 -74.0027  B02512
2     9/1/2014 0:03:00  40.7559 -73.9864  B02512
'''
    # 行标题小写
    lowercase = lambda x: str(x).lower()
    data.rename(lowercase, axis='columns', inplace=True)
    '''
      date/time      lat      lon    base
0     9/1/2014 0:01:00  40.2201 -74.0021  B02512
1     9/1/2014 0:01:00  40.7500 -74.0027  B02512
2     9/1/2014 0:03:00  40.7559 -73.9864  B02512
3     9/1/2014 0:06:00  40.7450 -73.9889  B02512
'''
    #转换日期时间格式
    data[DATE_COLUMN] = pd.to_datetime(data[DATE_COLUMN])
    '''
              date/time      lat      lon    base
0   2014-09-01 00:01:00  40.2201 -74.0021  B02512
1   2014-09-01 00:01:00  40.7500 -74.0027  B02512
2   2014-09-01 00:03:00  40.7559 -73.9864  B02512
3   2014-09-01 00:06:00  40.7450 -73.9889  B02512
'''
    return data

# 将st.text 占位部件命名,方便改变显示内容
data_load_state = st.text('Loading data...')
data = load_data(10000)
# 根据数据cache加载状态更新该部件显示的内容
data_load_state.text("Done! (using st.cache)")


if st.checkbox('显示原始数据'):
    st.subheader('原始数据') # 标题
    st.write(data)

st.subheader('每小时接客数量')

# numpy.histogram()函数将输入数组和bin作为两个参数
# bin数组中的连续元素用作每个bin的边界
hist_values = np.histogram(data[DATE_COLUMN].dt.hour, bins=24, range=(0,24))[0]
# 直方图:st.bar_chart()
st.bar_chart(hist_values)

# Some number in the range 0-23,默认值18
hour_to_filter = st.slider('hour', 0, 23, 18)
filtered_data = data[data[DATE_COLUMN].dt.hour == hour_to_filter]

st.subheader('%s:00 接客数量地图' % hour_to_filter)
st.map(filtered_data)
组件开发 Create a Streamlit Component
可以使用 JavaScript 和 HTML 开发组件,并在 streamlit app中调用渲染。理论上,vue.js 等技术可以和 streamlit 结合使用了。
正文完