使用 supervisor 部署 streamlit app
创建文件 /etc/supervisor/conf.d/streamlitAPP.conf
[program:streamlitAPP]
command = /home/username/miniconda3/bin/streamlit run /path2/app.py
directory = /home/username
autostart = true
startsecs = 20
autorestart = true
startretries = 3
user = username
environment = STNORESTART="1", HOME="/home/username"
开始运行:
添加:
sudo supervisorctl update
启动
supervisorctl start streamlitAPP
重启
supervisorctl restart streamlitAPP
停止
supervisorctl stop streamlitAPP
Streamlit 中调用 pyecharts
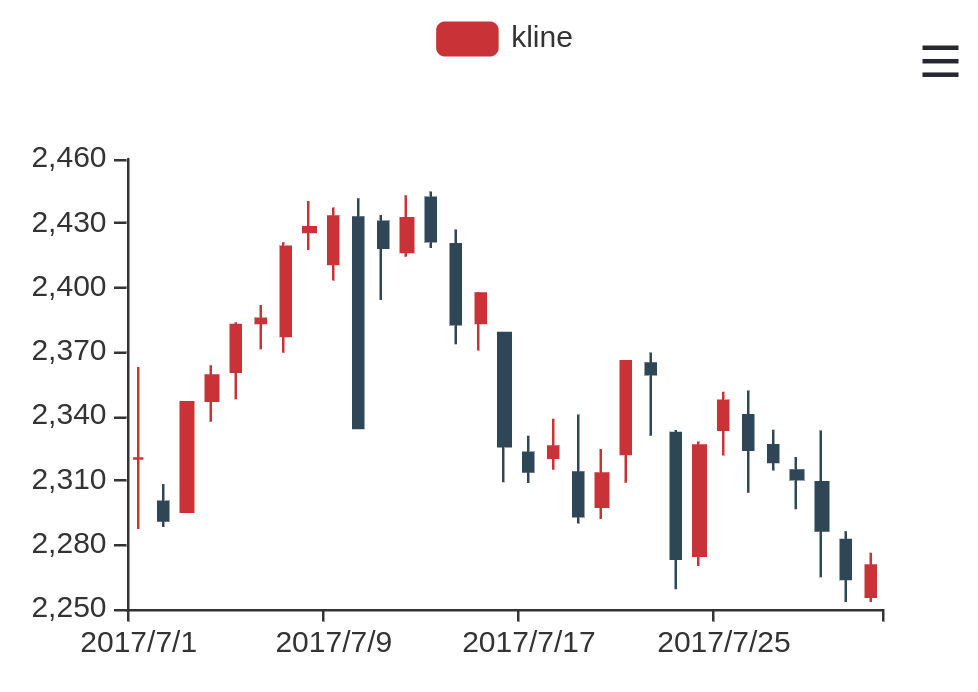
示例: 画K线图
#!/usr/bin/env python3
# -*- coding: utf-8 -*-

# pip install pyecharts
from pyecharts.charts import Kline
# pip install streamlit-echarts
from streamlit_echarts import st_pyecharts

data = [[2320.26, 2320.26, 2287.3, 2362.94], [2300, 2291.3, 2288.26, 2308.38],
      [2295.35, 2346.5, 2295.35, 2345.92], [2347.22, 2358.98, 2337.35, 2363.8],
      [2360.75, 2382.48, 2347.89, 2383.76], [2383.43, 2385.42, 2371.23, 2391.82],
      [2377.41, 2419.02, 2369.57, 2421.15], [2425.92, 2428.15, 2417.58, 2440.38],
      [2411, 2433.13, 2403.3, 2437.42], [2432.68, 2334.48, 2427.7, 2441.73],
      [2430.69, 2418.53, 2394.22, 2433.89], [2416.62, 2432.4, 2414.4, 2443.03],
      [2441.91, 2421.56, 2418.43, 2444.8], [2420.26, 2382.91, 2373.53, 2427.07],
      [2383.49, 2397.18, 2370.61, 2397.94], [2378.82, 2325.95, 2309.17, 2378.82],
      [2322.94, 2314.16, 2308.76, 2330.88], [2320.62, 2325.82, 2315.01, 2338.78],
      [2313.74, 2293.34, 2289.89, 2340.71], [2297.77, 2313.22, 2292.03, 2324.63],
      [2322.32, 2365.59, 2308.92, 2366.16], [2364.54, 2359.51, 2330.86, 2369.65],
      [2332.08, 2273.4, 2259.25, 2333.54], [2274.81, 2326.31, 2270.1, 2328.14],
      [2333.61, 2347.18, 2321.6, 2351.44], [2340.44, 2324.29, 2304.27, 2352.02],
      [2326.42, 2318.61, 2314.59, 2333.67], [2314.68, 2310.59, 2296.58, 2320.96],
      [2309.16, 2286.6, 2264.83, 2333.29], [2282.17, 2263.97, 2253.25, 2286.33],
      [2255.77, 2270.28, 2253.31, 2276.22]]

k=(
     Kline()
         .add_xaxis(["2017/7/{}".format(i + 1) for i in range(31)])
         .add_yaxis("kline", data)

     )

st_pyecharts(k)
效果:

正文完