5分钟上手 pyecharts
参考:5分钟上手
1.方法的链式调用与单独调用
单独调用:
#!/usr/bin/env python3
# -*- coding: utf-8 -*-
from streamlit_echarts import st_pyecharts
from pyecharts.charts import Bar

# 创建一个柱状图实例
bar = Bar()
# x,y列添加数据列表
bar.add_xaxis(["衬衫", "羊毛衫", "雪纺衫", "裤子", "高跟鞋", "袜子"])
bar.add_yaxis("商家A", [5, 20, 36, 10, 75, 90])
# 使用字典传入参数
bar.set_global_opts(title_opts={"text": "主标题", "subtext": "副标题"})
st_pyecharts(bar)
链式调用:
#!/usr/bin/env python3
# -*- coding: utf-8 -*-
from streamlit_echarts import st_pyecharts
from pyecharts.charts import Bar

bar = (Bar()
       .add_xaxis(["衬衫", "羊毛衫", "雪纺衫", "裤子", "高跟鞋", "袜子"])
       .add_yaxis("商家A", [5, 20, 36, 10, 75, 90])
       .set_global_opts(title_opts={"text": "主标题", "subtext": "副标题"})
)

st_pyecharts(bar)
pyecharts 所有方法均支持链式调用。链式调用更简洁。
使用 options 配置项,在 pyecharts 中,一切皆 Options。
2.使用主题
pyecharts 提供了 10+ 种内置主题,开发者也可以定制自己喜欢的主题.
直接按例子调用主题是没用的:
#!/usr/bin/env python3
# -*- coding: utf-8 -*-
from streamlit_echarts import st_pyecharts
from pyecharts.charts import Bar
from pyecharts.globals import ThemeType
from pyecharts import options as opts

bar = (Bar(init_opts=opts.InitOpts(theme=ThemeType.LIGHT))
       .add_xaxis(["衬衫", "羊毛衫", "雪纺衫", "裤子", "高跟鞋", "袜子"])
       # bar 的两个Y数据列
       .add_yaxis("商家A", [5, 20, 36, 10, 75, 90])
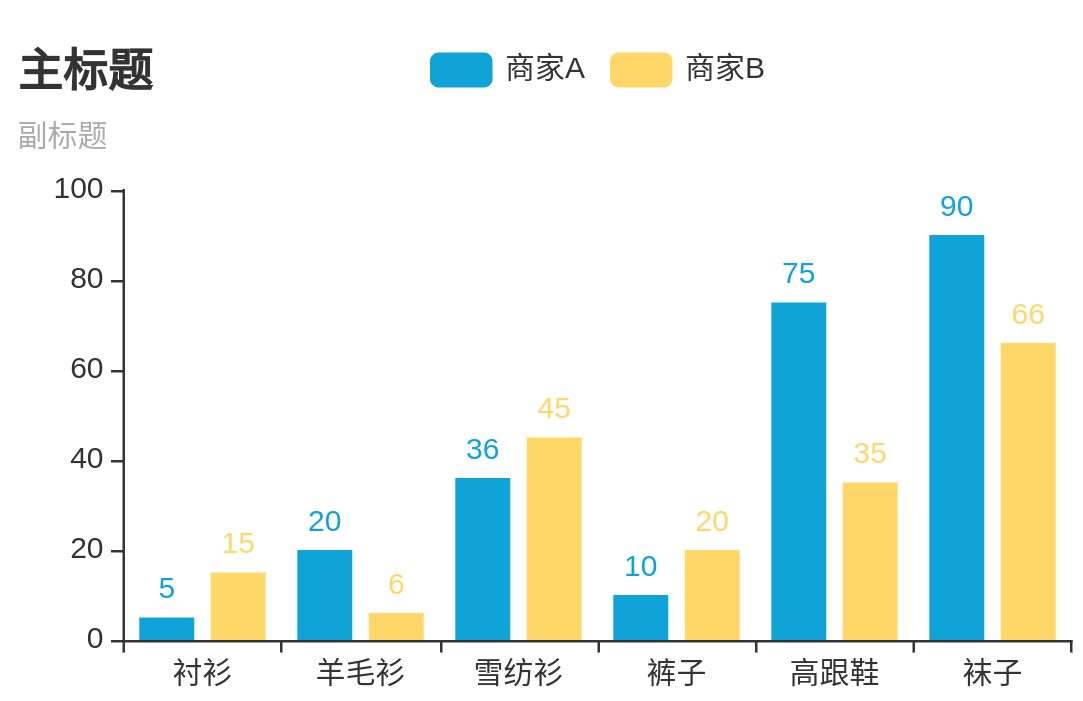
       .add_yaxis("商家B", [15, 6, 45, 20, 35, 66])
       .set_global_opts(title_opts={"text": "主标题", "subtext": "副标题"})
)


st_pyecharts(bar)
参考 这里:
Defining the theme in Pyecharts when instantiating chart like Bar(init_opts=opts.InitOpts(theme=ThemeType.LIGHT)) does not work, you need to call theme in st_pyecharts(c, theme=ThemeType.LIGHT).
修改版,需要同时在st_pyecharts 中添加theme参数:
#!/usr/bin/env python3
# -*- coding: utf-8 -*-
from streamlit_echarts import st_pyecharts
from pyecharts.charts import Bar
from pyecharts.globals import ThemeType
from pyecharts import options as opts

bar = (Bar(init_opts=opts.InitOpts(theme=ThemeType.LIGHT))
       .add_xaxis(["衬衫", "羊毛衫", "雪纺衫", "裤子", "高跟鞋", "袜子"])
       # bar 的两个Y数据列
       .add_yaxis("商家A", [5, 20, 36, 10, 75, 90])
       .add_yaxis("商家B", [15, 6, 45, 20, 35, 66])
       .set_global_opts(title_opts={"text": "主标题", "subtext": "副标题"})
)


st_pyecharts(bar,theme=ThemeType.LIGHT)
效果:

基本图表 Calendar:日历图
参考:
示例1
#!/usr/bin/env python3
# -*- coding: utf-8 -*-
from streamlit_echarts import st_pyecharts

import random
import datetime

import pyecharts.options as opts
from pyecharts.charts import Calendar


begin = datetime.date(2017, 1, 1)
end = datetime.date(2017, 12, 31)
# 造模拟数据
data = [
    [str(begin + datetime.timedelta(days=i)), random.randint(1000, 25000)]
    for i in range((end - begin).days + 1)
]

'''[['2017-01-01', 15312],
 ['2017-01-02', 8095],
 ['2017-01-03', 24504],
 ['2017-01-04', 9012],
 ['2017-01-05', 14732]]'''

c=(
    Calendar()
    .add(
        series_name="",
        yaxis_data=data,
        calendar_opts=opts.CalendarOpts(
            pos_top="120",
            pos_left="30",
            pos_right="30",
            range_="2017",
            yearlabel_opts=opts.CalendarYearLabelOpts(is_show=False),
        ),
    )
    .set_global_opts(
        title_opts=opts.TitleOpts(pos_top="30", pos_left="center", title="2017年步数情况"),
        visualmap_opts=opts.VisualMapOpts(
            max_=20000, min_=500, orient="horizontal", is_piecewise=False
        ),
    )
)

st_pyecharts(c)
正文完